Technical Insights
Jitter Transfer Functions in Minutes
![]() 7 min
7 min
![]() 6 min
6 min

In the semiconductor industry, shmoo plots have become an indispensable tool for assessing the health of a device under test (DUT), for tracking process variations and analyzing manufacturing yield, and for client-specific characterization and speed binning. Traditionally, in order to obtain shmoo plots, engineers had to use large automatic test equipment (ATE) that has been designed primarily for production testing and not for engineering or characterization tasks. This has resulted in multiple challenges related to availability of equipment and also cost of the equipment. In this article, we describe how Introspect’s M Series makes obtaining shmoo plots easier than ever. But first, let us introduce the concept of the shmoo and how it is used.
Referring to Figure 1, a shmoo plot is a tool for visualizing multidimensional data. In a typical semiconductor context, it is a tool to distinguish between test conditions (parameter values) under which a test run result is a “Pass” and other conditions under which a test run result is a “Fail”. The nature of the test in this case is completely irrelevant, and the shmoo is only intended to rapidly identify the parameter values that move a DUT from passing to failing a particular test. For example, in Figure 1, a test that was executed at 250 ps Jitter Amplitude and 4 MHz Jitter Frequency has passed, whereas the same test at 250 ps Jitter Amplitude and 9 MHz Jitter Frequency has failed.
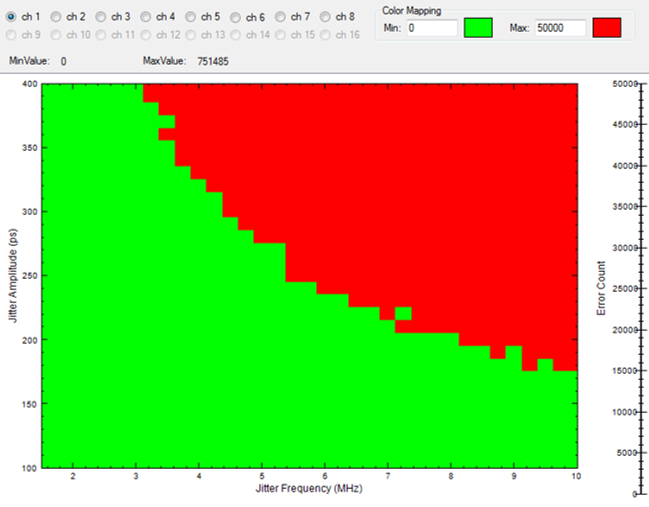
Figure 1: Example of a Shmoo plot.
In general, the following characteristics are needed for a Shmoo tool to be useful:
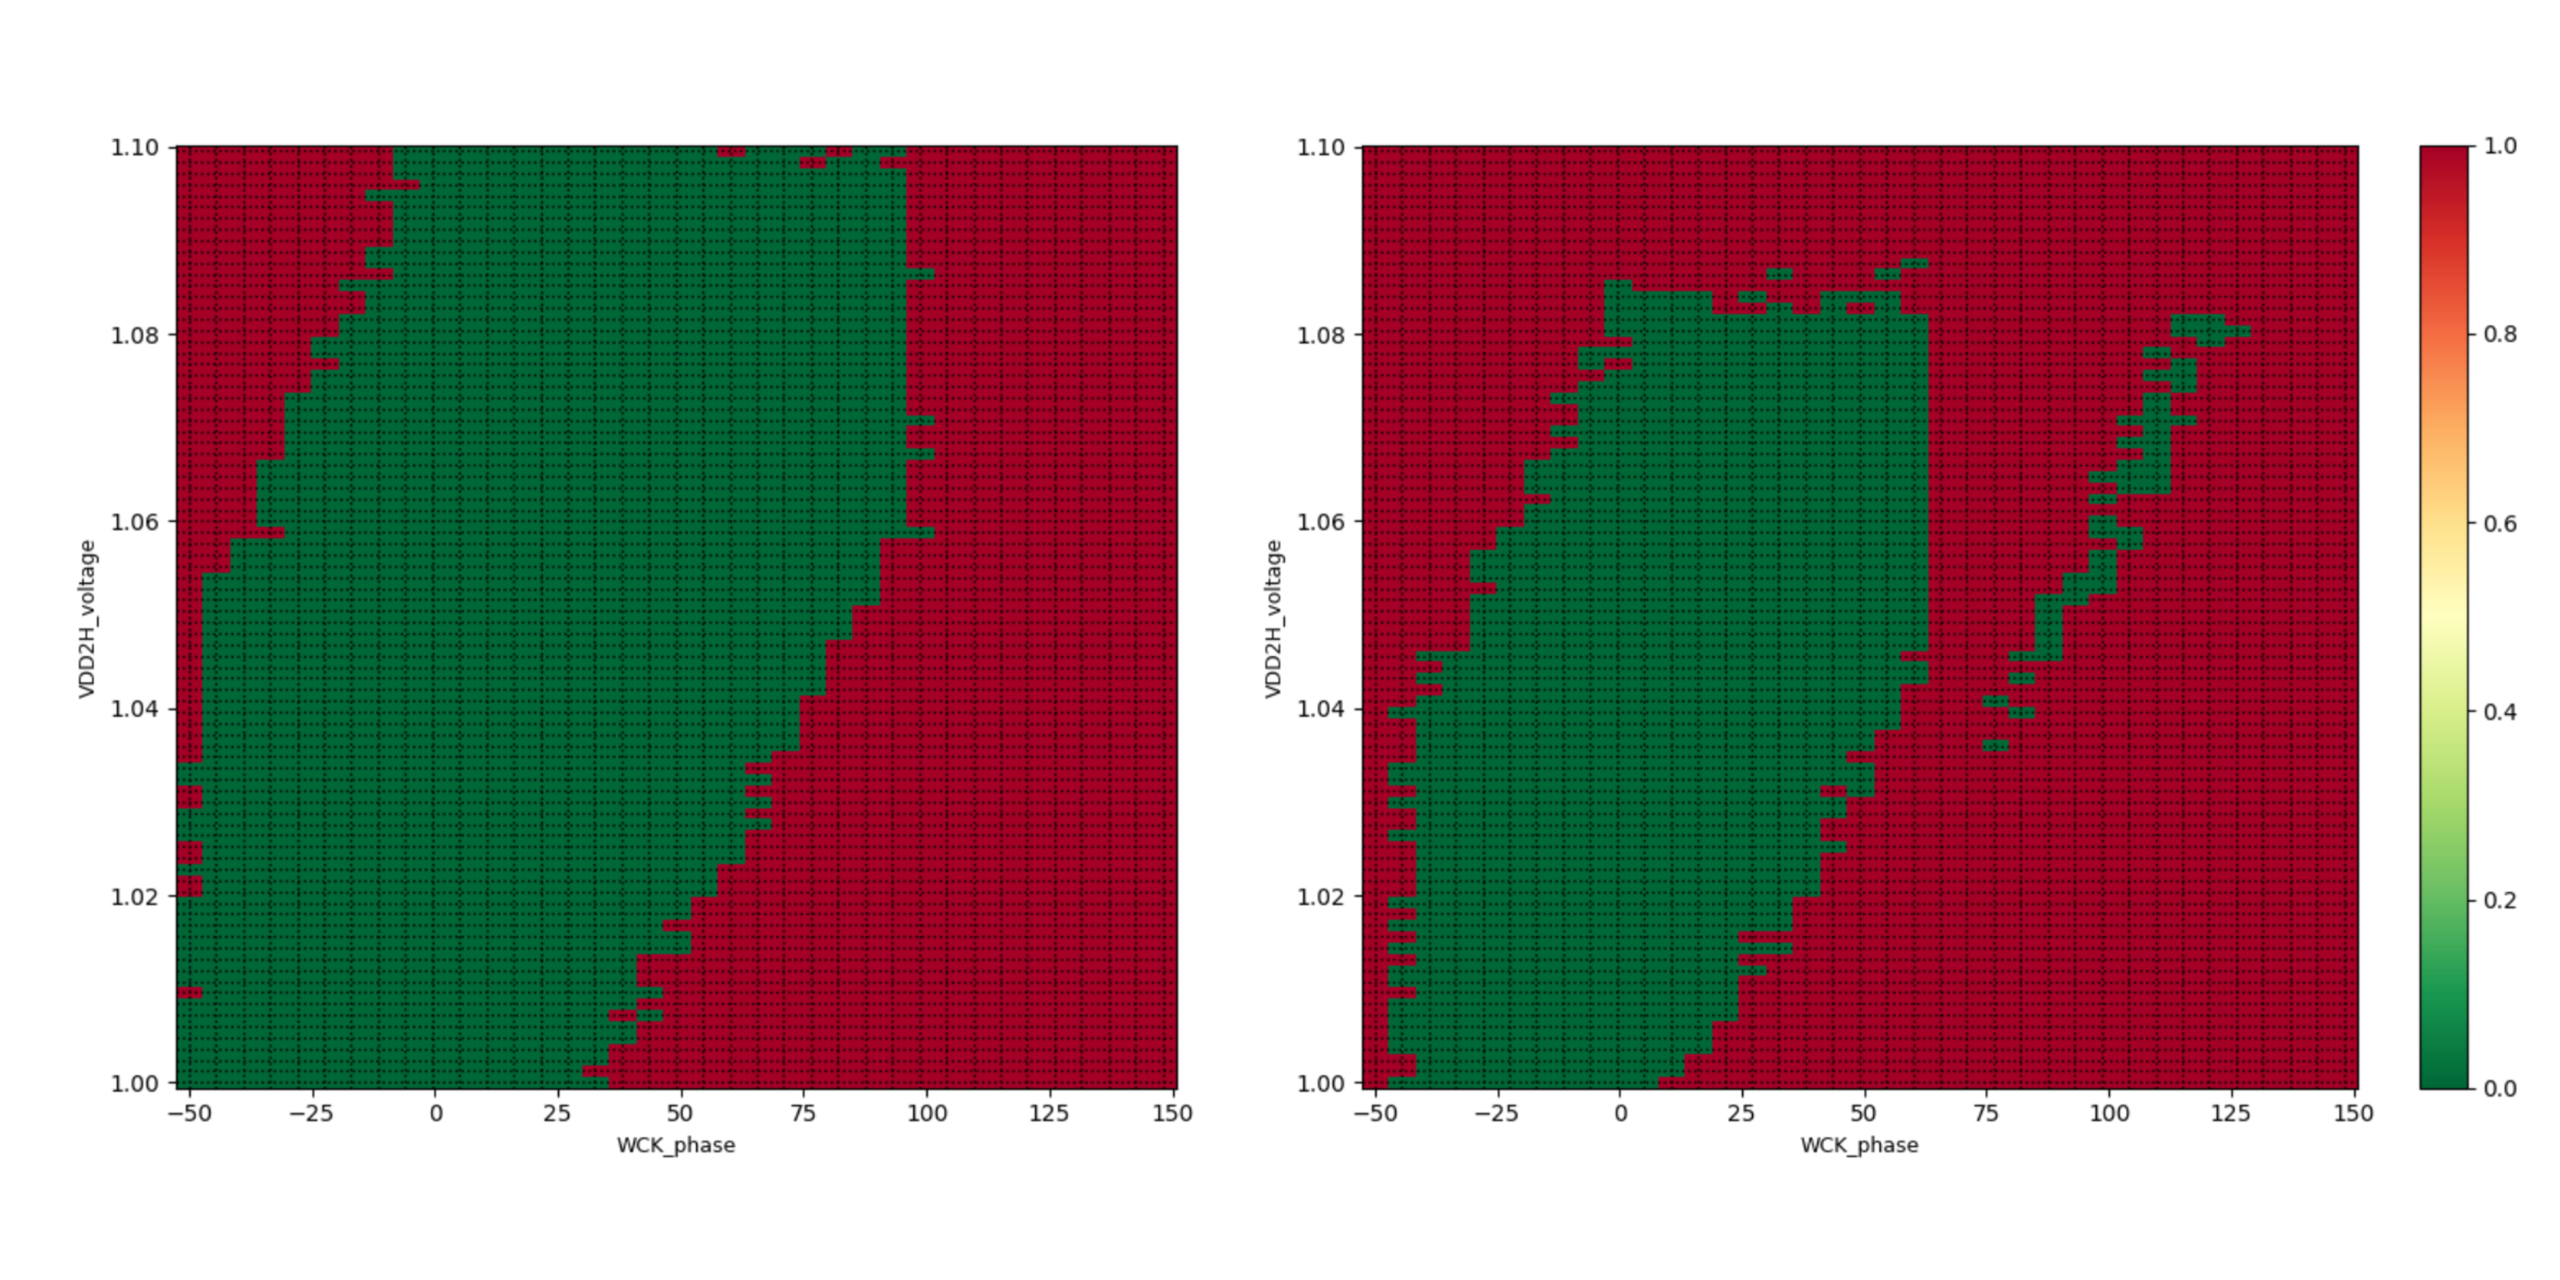
One of the most important types of shmoo tests that engineers run is one in which the voltage rail supplied to the DUT is varied. That is, one of the parameters in the multi-dimensional shmoo plot would be the VDD rail. An example of such a plot is shown in Figure 2 below. Oftentimes, design flaws or process sensitivities would be exposed most clearly when the power supply rail of the DUT is adjusted.
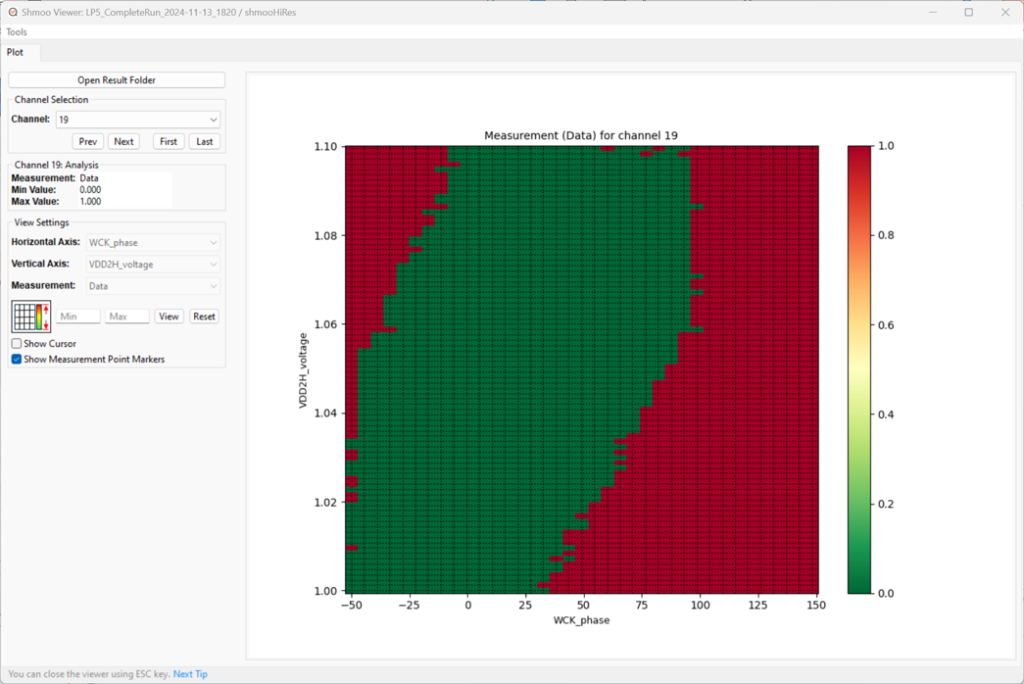
Figure 2: Real device shmoo plot in which the vertical axis is the VDD voltage supplied to the DUT.
As part of Introspect’s ATE-on-Bench technology, we are always striving to bring tools that help make characterization more friendly and more accessible to engineers. Thus, we have introduced programmable device power supplies to our M Series ATE-on-Bench testers, and this means that it is possible to now create advanced shmoo plots directly from the comfort of your desk or your laboratory bench! Figure 3 shows an example of a device power supply that is mounted directly on a test board that is attached to our M5504 tester.
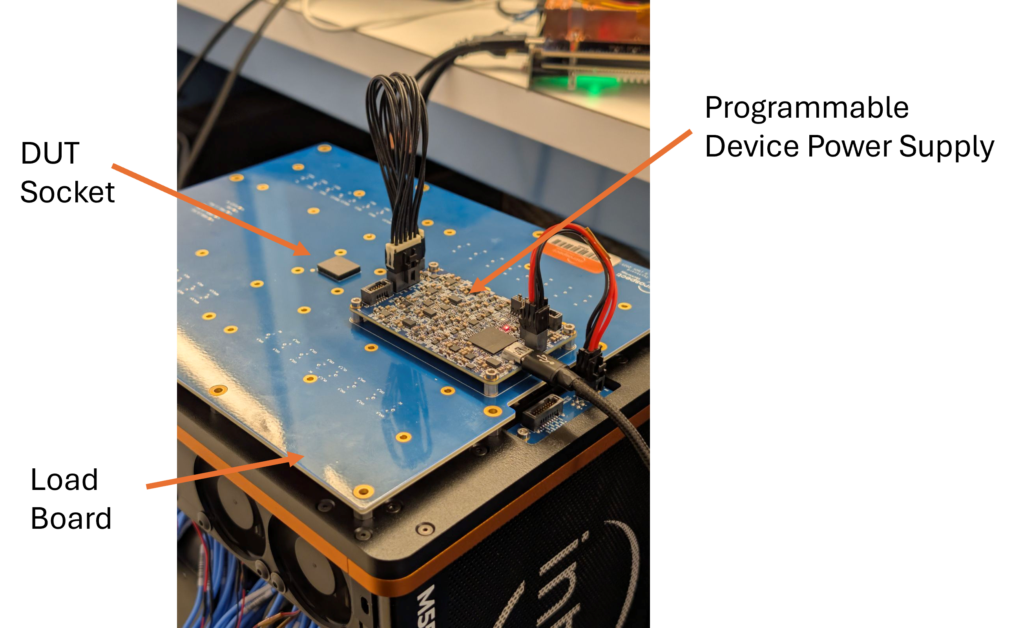
Figure 3: Illustration of a programmable supply that is integrated with the M5504.
The integration of this device power supply technology has two main advantages:
Figure 2 above showed a real device test example in which one of the parameters being swept was the VDD voltage supplied to the DUT. The second parameter was the phase of a clock. That is, this test was essentially measuring the setup and hold time on a high-speed device as a function of VDD. The particular test was executed at a fixed data rate. Now, let us see what happens when the data rate on the DUT is increased. When the data rate has increased by 33% on the same device and the same test environment, the shmoo plot looks like that in Figure 4. As can be seen, the red region is larger than that in Figure 2, and the DUT fails at voltages above 1.08 V even though it used to pass at voltages as high as 1.10 V. Counterintuitive as it may be, this result is an excellent example of how useful the shmoo tool is. It provides insights into device performance that would be difficult to obtain otherwise.
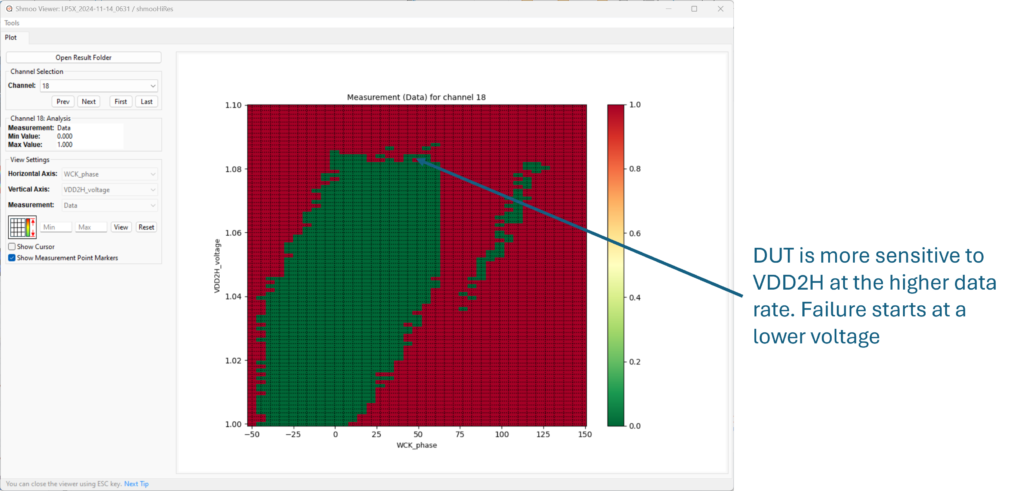
Figure 4: Shmoo plot of the same device as Figure 2 but running at a data rate that is 33% higher. The device fails at voltages above 1.08V, which is a bit counterintuitive.
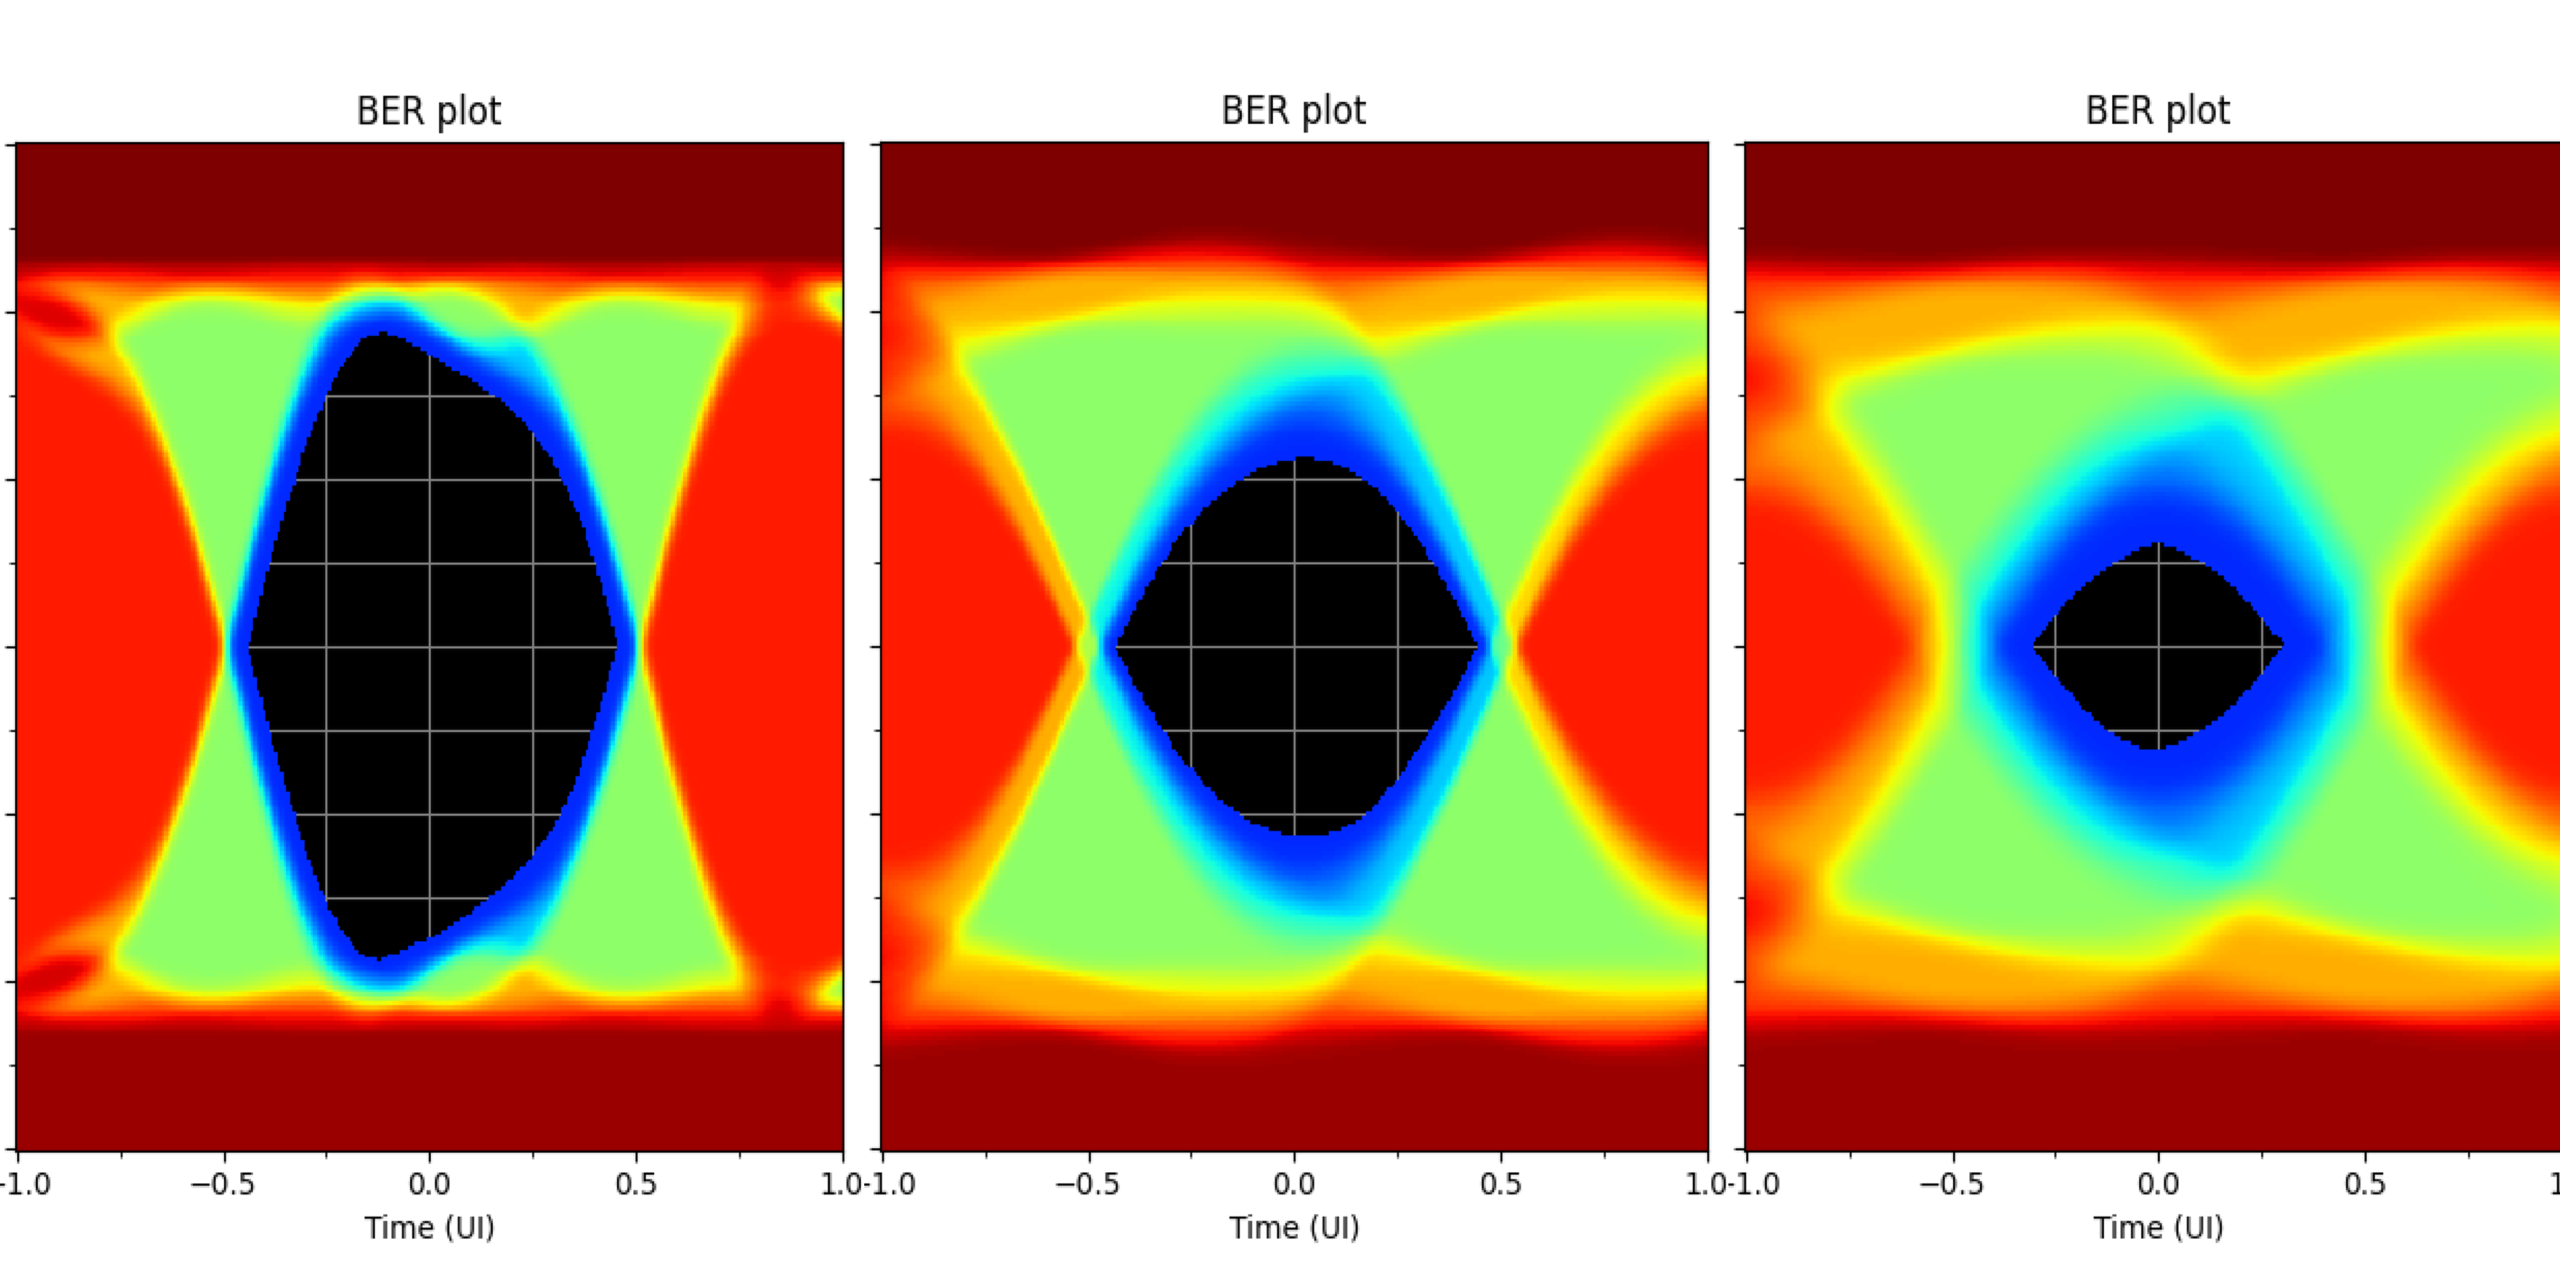
Speaking of data rate, a classic shmoo test is one that involves sweeping a power supply rail against operating data rate for the device under test. Figure 5 shows such a test for a commercial LPDDR5 DRAM device. As can be seen, this DUT performs well across the entire data rate range, although the performance is not always constant. Some data rates exhibit additional sensitivity, and this is exactly why the shmoo test is performed. Finally, Figure 6 shows the same shmoo test, but with an error rate metric instead of a simple pass/fail metric. Sometimes, more insights can be obtained when the shmoo is performed with a parametric measure like this instead of a binary pass/fail measure.
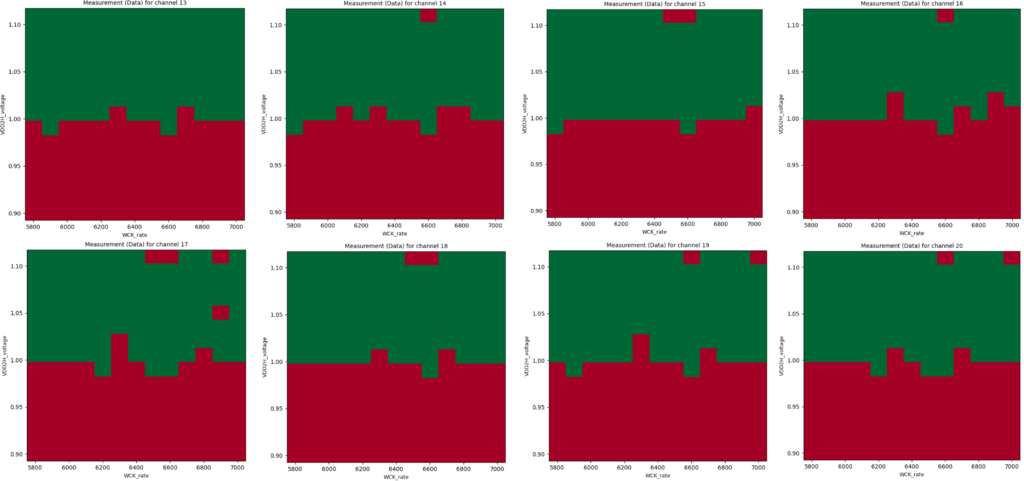
Figure 5: Shmoo plot of a LPDDR5 memory device showing the pass/fail data for every pin in the DQ bus.
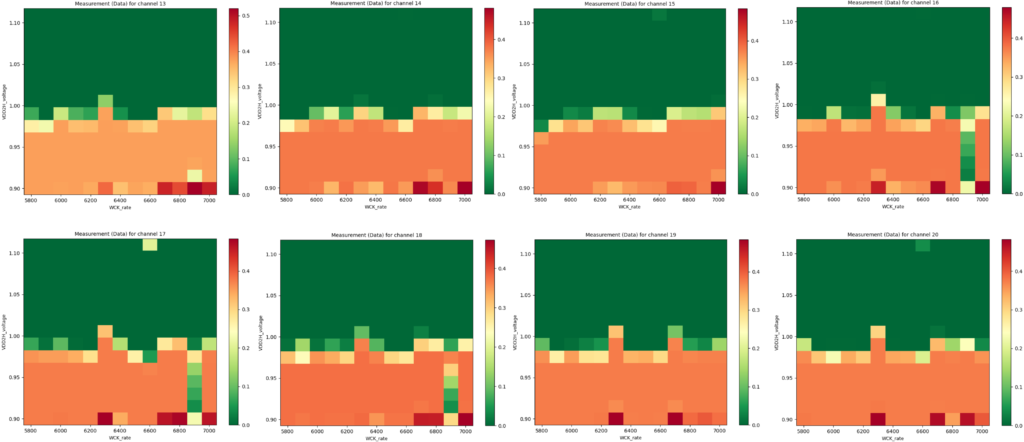
Figure 6: Shmoo plot for the above memory device, but using a bit error rate measurement instead of a pass/fail measurement.
In this article, we introduced the concept of a shmoo plot. We also showed how Introspect has been supporting shmoo testing for a long time with our customers. And we illustrated real device examples and some of the insights that the shmoo plot can give.
Do you need to perform shmoo testing? Please reach out to us at info@introspect.ca for more information and to discover how powerful our shmoo capability is.