
Technical Insights
Importing and Exporting Python Modules
![]() 5 min
5 min
![]() 4 min
4 min


The Introspect ESP Software is a very powerful automation environment that leverages the Python programming language. This means that various Python modules can be imported into the Introspect ESP Software, and this is exactly what the team at Introspect Technology has done. Instead of burdening the users with importing Python modules, we have done it for you! And perhaps there is no better example of this than Matplotlib. This library is a powerful tool that enables scientific computing. However, it can sometimes be intimidating to use. So, not only did Introspect Technology automatically import it into our software, but we also created high level plotting tools on top of it. Read on to learn more.
A large premise of the Introspect software is that it is intended to be used by test engineers, validation engineers, and hardware engineers. Imagine you wanted to plot the frequency response of a filter as in the following figure:
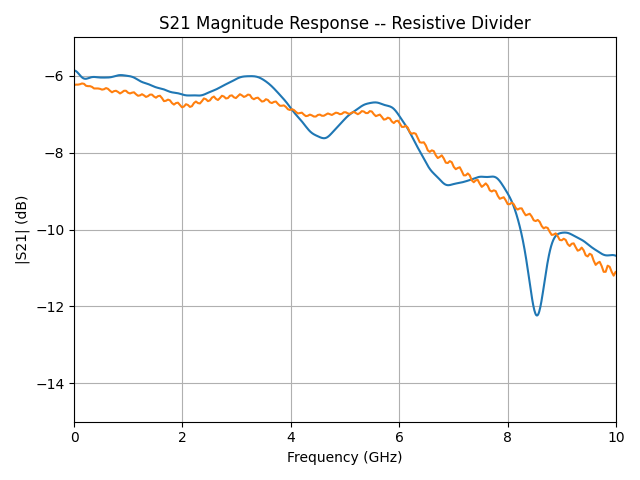
Figure 1: Example of a measurement plot that a test engineer might want to generate
Ideally, the engineer just gets an array of x values and an array of y values, and then these arrays are plotted. We do not want the engineer to worry about the syntax for importing libraries such as NumPy and Matplotlib. So, we create the component PlotCreatorBasic and the more advanced component PlotCreator.
By default, this component creates line plot of the lists defined in the attributes xValues and yValues. For example, you can declare the following variables in the Test Procedure:
myXValues = [0,1,2,3,4,5,6,7,8,9]
myYValues = [0, 1, 4, 9, 16, 25, 36, 49, 64, 81]
Then, simply attach these two lists to the xValues and yValues attributes of the PlotCreatorBasic component by editing its property table. Next, add the following command in the Test Procedure:
plotCreatorBasic.run()
The result is a graph like the one shown in the next figure.
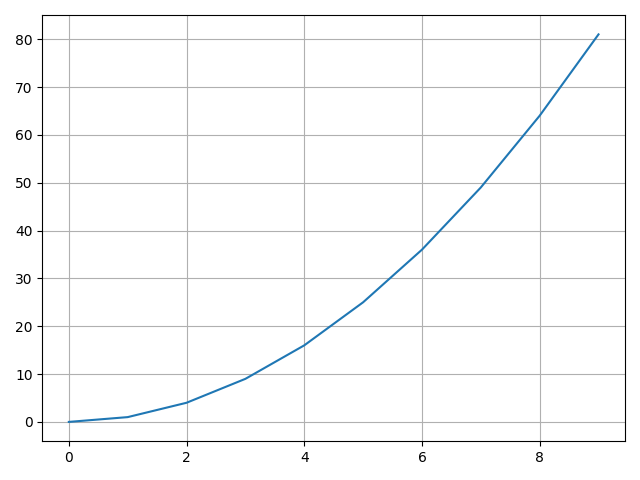
Figure 2: Result of executing plotCreatorBasic.run() on the above two lists
Refinements can easily be made to the generated plot by adding x-axis and y-axis labels. These are simply text strings that you insert into the corresponding attributes in the property table of the component. An example output plot is shown in the following figure.
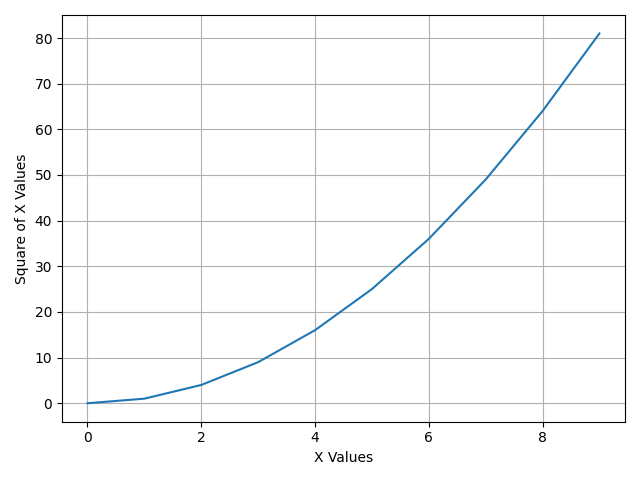
Figure 3: Adding x and y axis labels
The PlotCreator component is a more advanced version of the PlotCreatorBasic component, and it allows for plotting multiple data sets and for providing fine control over trace widths, colors, and styles. For example, imagine you had multiple frequency response measurement results, and you wanted to summarize them into a single graph? The PlotCreator component can enable this with a single command. It provides a code container in which you can define data set variables and then manipulate their plots. An example of a result graph is the one shown in the following figure.
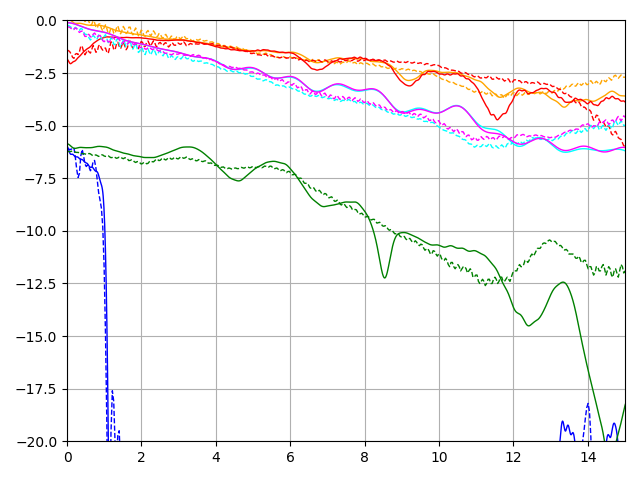
Figure 4: Using PlotCreator to generate more advanced scientific graphs
One of the strengths of the PlotCreator component is that it can iterate on data sets using “for” loops or other Python loop utilities. For example, imagine you obtained a waveform using the Introspect AnalogCapture component and now you want to convert that waveform into an eye diagram. The PlotCreator component can be used to loop over the number of unit intervals you captured so that it can create an eye diagram. The following figure is a 20 bit digital pattern that was obtained using AnalogCapture.
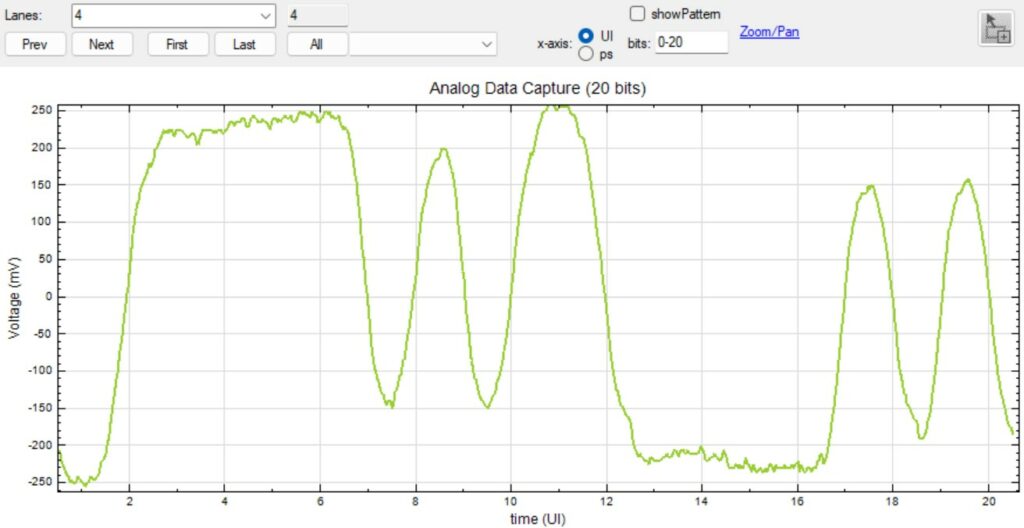
Figure 5: Analog waveform we want to convert into an eye diagram
Now, simply reshape the waveform into a group of twenty waveforms. Then insert the following code into the PlotCreator code editor:
xvals = delays[4][0:32]
for i in range(20) :
    myArray = myVoltages[4]
    yValues = myArray[i,:]
    dataSet1 = SvtPlotDataSet(xvals, myArray[i,:])
    dataSet1.setLineStyle(':',2)
    dataSet1.setColor('purple')
    plotA.addDataSet(dataSet1)
The result is the eye diagram in the following figure.
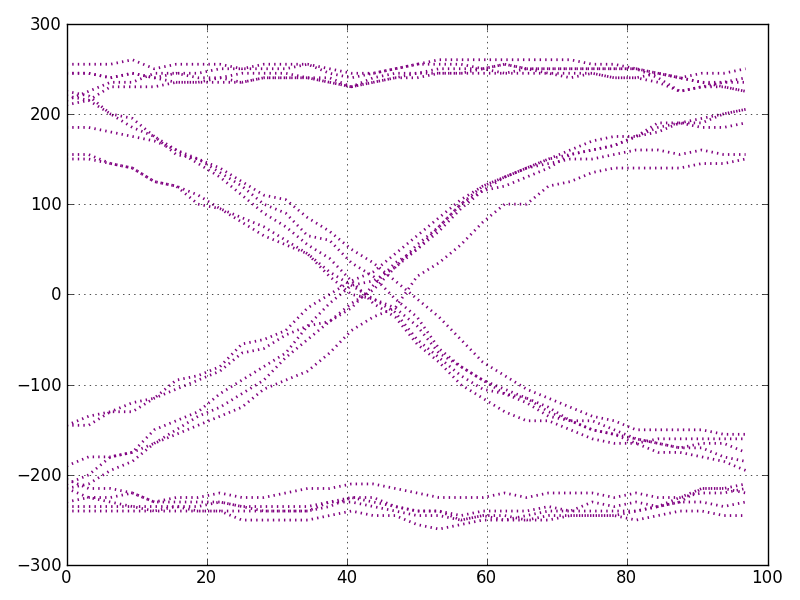
Figure 6: Generated eye diagram using PlotCreator
In this blog post, we shed some light on the PlotCreatorBasic and PlotCreator components. These are powerful high-level Python component classes that allow for the creation of sophisticated scientific computing graphs without having to spend time understanding Python module syntax.

